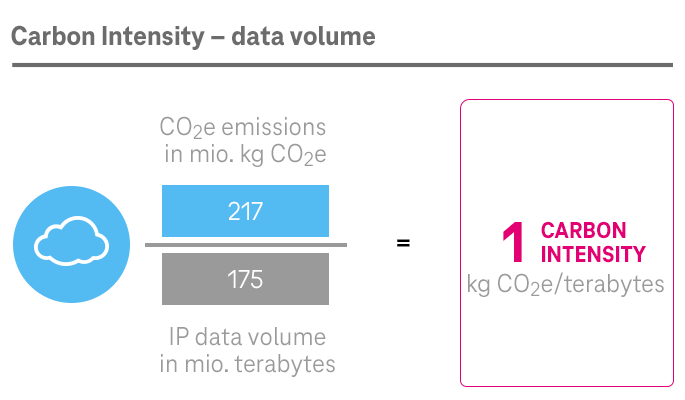
This year sees us reporting our carbon intensity on the basis of two different indicators: data volume and revenue. Both KPIs take into account total CO2e emissions (Scopes 1 and 2) for all energy sources – electricity, fuel, gas and district heating.
We began to report our CO2e emissions in proportion to our managed data volumes in 2016 in the form of the ESG KPI “Carbon Intensity” – data volume. Using data volume as a reference parameter makes it possible to create a direct link to the performance of our networks. The data volume is composed of the transmitted IP data volumes (including Voice over IP, Internet, IP-TV).
Our ambition in this connection: reduce the KPI
There has been a significant reduction in carbon intensity, relative to data volume, since 2021.
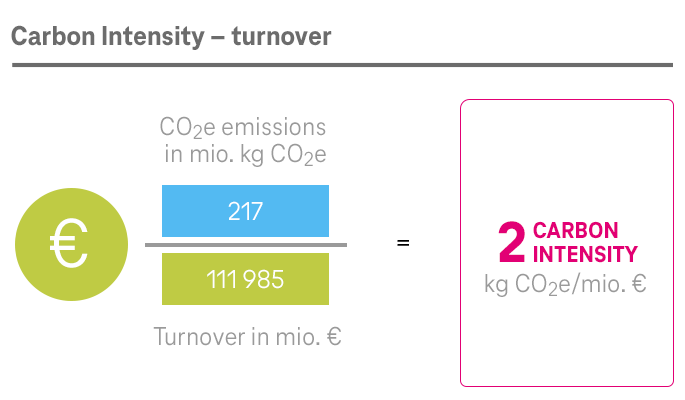
In preparation for future reporting in accordance with the CSRD, this year we are not only reporting carbon intensity relative to data volume, but also carbon intensity relative to revenue. This allows us to measure our progress in reducing our CO2e emissions within the context of our economic performance.
To enable better comparison between this indicator and the ratio of carbon intensity to data volume, we slightly modified the calculation methodology for the Group’s values in 2023. Starting in 2023, we now include the CO2e emissions (Scope 1 and 2) of all segments, including those outside our fixed-network and mobile business segments (such as cloud business).
Total CO2e emissions (Scopes 1 to 3) in the DT Group
KPI
We present our Scope 1 to 3 greenhouse gas emissions uniformly so that they can be compared with each other. To that end, emissions are converted into metric kilotons of CO2 equivalents (CO2e). In addition to CO2, we also consider CH4 and N2O, and are working on integrating HFCs (refrigerants) into the calculation as well. Biogenic CO2 emissions were not recorded separately for the year 2023, as they only occur to a small extent. We break down the emissions that occur along our value chain; this gives us an overview of where in the value chain the majority of them occur.
By making a complete transition to electricity from renewable energies in 2021, we were able to considerably reduce our Scope 2 emissions. In 2023, market-based Scope 1 and 2 emissions throughout the Group amounted to around 217 000 metric tons of CO2e, or about 6.9 percent lower than in the previous year.
In 2023, Scope 3 emissions decreased in comparison with the previous year – from 11.8 million metric tons to around 10.5 million metric tons of CO2e. This reduction partly resulted from methodology adjustments for upstream activities in particular. Most of the Scope 3 emissions resulted from the manufacture of products and components (in particular devices and network technology), and from the use of our products and services (for example, sold or rented fixed-line and mobile phones, routers, and media receivers) by our customers. Some 2 million metric tons of CO2e are additionally generated during the utilization phase of our solutions by devices that our customers purchase from third parties and not from Deutsche Telekom. As we have only a negligible influence on these devices and hence on their energy consumption and emissions, we have reported these emissions separately since 2022. Since 2022, emissions caused by visits to Telekom Shops by our customers have also been included for Germany and Europe.
Currently, we are studying various factors that will influence the quantities of our future emissions (Scopes 1 to 3). For example, our suppliers’ climate-protection efforts are having a positive impact. In addition, lower power mix factors, and improved energy efficiency in the devices used in connection with our products and services, can be expected to lower emissions. The fall in emissions from our employees commuting to and from work also has a small positive impact. On the other hand, it is possible that higher numbers of (new) devices used in connection with our products and services will increase emissions.
CO2e emissions (Scope 1-3)
Interactive graphics
72.49 %
1.86 %
0.17 %
25.48 %
Emissions from upstream activities
Scope 3
7 752 kt CO2e
Transportation services, purchased products and services, capital goods, production waste, upstream energy and fuel supply chains, business travel, and employee commuting.
Emissions from Deutsche Telekom's own activities
Scope 1
199 kt CO2e
Operating the systems, buildings, and vehicles belonging to Deutsche Telekom.
Emissions from purchased energy
Scope 2
18 kt CO2e
Generation of district electricity and heating purchased by Deutsche Telekom.
Emissions from downstream activities
Scope 3
2 724 kt CO2e
Transportation of products sold to customers, use of sold and rented products and disposal and recycling of sold products.
Please click on the percent values for further information. Click to return to the overview
Data assured by Deloitte. Data partly based on estimates, assumptions and projections. Includes compensation from purchased certificates.
Total CO2e emissions (Scopes 1 to 3) in segments
KPI
In addition to discussing the emissions of the Group as a whole, we provide separate information on Scope 1 to 3 emissions for the segments. We present our Scope 1 to 3 greenhouse gas emissions in a consistent manner, so that they can be compared with each other. To that end, emissions are converted into metric kilotons of CO2 equivalents (CO2e). In addition to CO2, we also consider CH4 and N2O, and are working on integrating HFCs (refrigerants) into the calculation as well. Biogenic CO2 emissions were not recorded separately for the year 2022, as they only occur to a small extent. We also break down emissions along our value chain. This gives us an overview of where most of the emissions are produced in the chain.
In all segments, most of these emissions occurred in the upstream value chain, as well as in our customers’ use of our products and services. In those emissions, we also include emissions resulting from the use of our services by our customers’ own devices, such as laptops or tablet computers.
Further details about all segments are provided here in the benchmarking tool.
Germany segment In 2023, market-based Scope 1 and 2 emissions for the Germany segment amounted to around 85 000 metric tons of CO2e. The Scope 3 emissions were 2.1 million metric tons of CO2e, thereby accounting for the largest emissions share.
CO2e emissions (Scope 1-3) for Germany
Interactive graphics
68.34 %
3.66 %
0.33 %
27.67 %
Emissions from upstream activities
Scope 3
1 459 kt CO2e
Transportation services, purchased products and services, capital goods, production waste, upstream energy and fuel supply chains, business travel, and employee commuting.
Emissions from Deutsche Telekom's own activities
Scope 1
78 kt CO2e
Operating the systems, buildings, and vehicles belonging to Deutsche Telekom.
Emissions from purchased energy
Scope 2
7 kt CO2e
Generation of district electricity and heating purchased by Deutsche Telekom.
Emissions from downstream activities
Scope 3
591 kt CO2e
Transportation of products sold to customers, use of sold and rented products and disposal and recycling of sold products.
Please click on the percent values for further information.
United States segment In 2023, market-based Scope 1 and 2 emissions for the United States segment amounted to around 46 000 metric tons of CO2e. The Scope 3 emissions were 6.3 million metric tons of CO2e, thereby accounting for the largest emissions share.
CO2e emissions (Scope 1-3) for USA
Interactive graphics
76.93 %
0.72 %
0 %
22.35 %
Emissions from upstream activities
Scope 3
4 903 kt CO2e
Transportation services, purchased products and services, capital goods, production waste, upstream energy and fuel supply chains, business travel, and employee commuting.
Emissions from Deutsche Telekom's own activities
Scope 1
46 kt CO2e
Operating the systems, buildings, and vehicles belonging to Deutsche Telekom.
Emissions from purchased energy
Scope 2
0 kt CO2e
Generation of district electricity and heating purchased by Deutsche Telekom.
Emissions from downstream activities
Scope 3
1 425 kt CO2e
Transportation of products sold to customers, use of sold and rented products and disposal and recycling of sold products.
Please click on the percent values for further information.
Europe segment In 2023, market-based Scope 1 and 2 emissions for the Europe segment amounted to around 49 000 metric tons of CO2e. The Scope 3 emissions were 1.6 million metric tons of CO2e, thereby accounting for the largest emissions share.
CO2e emissions (Scope 1-3) for Europe
Interactive graphics
58.66 %
2.73 %
0.31 %
38.29 %
Emissions from upstream activities
Scope 3
951 kt CO2e
Transportation services, purchased products and services, capital goods, production waste, upstream energy and fuel supply chains, business travel, and employee commuting.
Emissions from Deutsche Telekom's own activities
Scope 1
44 kt CO2e
Operating the systems, buildings, and vehicles belonging to Deutsche Telekom.
Emissions from purchased energy
Scope 2
5 kt CO2e
Generation of district electricity and heating purchased by Deutsche Telekom.
Emissions from downstream activities
Scope 3
621 kt CO2e
Transportation of products sold to customers, use of sold and rented products and disposal and recycling of sold products.
Please click on the percent values for further information.
System Solutions segment In 2023, market-based Scope 1 and 2 emissions for the Systems Solutions segment amounted to around 8 000 metric tons of CO2e. The Scope 3 emissions were 0.3 million metric tons of CO2e, thereby accounting for the largest emissions share.
CO2e emissions (Scope 1-3) for System Solutions
Interactive graphics
75.21 %
2.51 %
0.13 %
22.15 %
Emissions from upstream activities
Scope 3
225 kt CO2e
Transportation services, purchased products and services, capital goods, production waste, upstream energy and fuel supply chains, business travel, and employee commuting.
Emissions from Deutsche Telekom's own activities
Scope 1
8 kt CO2e
Operating the systems, buildings, and vehicles belonging to Deutsche Telekom.
Emissions from purchased energy
Scope 2
0 kt CO2e
Generation of district electricity and heating purchased by Deutsche Telekom.
Emissions from downstream activities
Scope 3
66 kt CO2e
Transportation of products sold to customers, use of sold and rented products and disposal and recycling of sold products.
Please click on the percent values for further information.
4-year trend: total CO2e emissions (Scopes 1 to 2) in the DT Group
KPI
Our CO2 emissions are largely driven by fleet fuels, fossil fuels and district heating. The table below contains detailed information about the Group numbers for the Scope 2 emissions resulting from our electricity consumption. We differentiate between the market-based and location-based methods, thereby adhering to the GHG Protocol Scope 2 Guidance. Market-based and location-based emissions are displayed in CO2 equivalents. This conversion was undertaken to facilitate transparent comparison between Scope 1 to 3 emissions and to align consistently with the requirements of the Science Based Targets initiative to which the new goal is also oriented.
The market-based approach is the main method used in our reporting. This method is used to calculate emissions with a specific emissions factor (provider factor) per DT company. This factor depends on a company’s actual energy procurement (electricity mix); procuring renewable energy (direct purchase, certificates) reduces emissions.a)
In contrast to the market-based method, with the location-based method the emissions factors for the respective country (the country mix factor) of the International Energy Agency (IEA) are used across the board. A company’s actual energy procurement (electricity mix), including the procurement of renewable energy that goes beyond the country mix, is therefore not taken into account.
Change compared to 2020: The Scope 2 emissions calculated according to the market-based method are about 99 percent lower than in 2020. The marked difference between the 2023 and 2020 figures is a result of the Group-wide use of green electricity, PPAs, and guarantees of origin. Since 2021, we have been sourcing 100 percent of the electricity we use, throughout the Group, from renewable energy sources. By reaching this milestone, we have achieved one of our climate targets.
2020
2021
2022
2023
a) If no provider factors are available for the market-based method, the country-related residual factor is used (based on the RE-DISS project of the European Commission, which assessed the national share of renewables). If there is no residual factor available either, the IEA factor is used (same as with the location-based method). As a rule, the value of the emission factor in the residual mix is higher than the IEA’s country mix factor. Renewable energy certificates are included in all cases. b) For the national company T-Mobile US, the market-based Scope 2 emissions were calculated using the eGRID emissions factors until 2020, which are reported by the American Environmental Protection Agency according to different grid regions in the USA. In addition, the quantities of electricity from renewable energy sources obtained under Power Purchase Agreements (PPAs) were taken into account in reducing emissions. c) The 2021 value has been corrected compared to the publication of the previous year. d) In past reporting periods, fugitive emissions had a limited impact on our overall scope 1+2 emissions and were not explicitly disclosed. However, with our recent transition to renewable energies, the proportional contribution of fugitive emissions has increased, prompting a renewed focus. While significant progress has been made, we are still in an early development stage of the data collection processes and reporting on fugitive emissions in this CR report is an evolving aspect. Ongoing efforts reflect our commitment to refining the reporting processes for a more comprehensive portrayal of our environmental impact related to refrigerants, fire suppressants, and associated emissions.
Data verified by Deloitte. Data is partly based on estimates, assumptions and projections. Includes offsets from purchased certificates.
Scope 1 and Scope 2 („market-based“) a,b)
Total in million
2.5
0.2
0.2
0.2
t CO2e emissions Scope 1
235 261
218 971 c)
212 044
199 023
t CO2e emissions Scope 2 („market-based“) a,b)
2 276 607
27 290 c)
21 019
17 957
t CO2e emission reduction through additional purchase of electricity from renewable energies (PPA, GOO, RECS)
4-year trend: total CO2e emissions (Scope 3) in the DT Group
KPI
The majority of our total emissions can be classified as Scope 3 emissions. Scope 3 emissions are all emissions from upstream or downstream value chains that are produced in supply chains, through business travel, through employee commuting (upstream) or through customers’ use of products and services (downstream). They are determined in accordance with the globally accepted Greenhouse Gas (GHG) Protocol.
In order to reduce our Scope 3 emissions, we are placing increasing priority on climate-protection criteria in our supply chains. This commitment is reflected in our CDP Supplier Engagement Rating, for which we have been repeatedly awarded the top grade of “A” in recent years. The rating for the year under review had not yet been announced at the time of the publication of this report. Our ESG KPI “CDP Supply Chain Program” indicates the degree to which our procurement volume from carbon-intensive suppliers is covered by the CDP Supply Chain Program. We are also leveraging the benefits of blockchain technology and the NFT approach as part of a research project that aims to create a decentralized application for making visible the impact of product manufacture and transport by suppliers on Scope 3 emissions. A blockchain infrastructure is being established for collecting data on CO2 emissions along the supplier value chain. A unique NFT is being created for the data collected and will be handed over to suppliers in the form of a certificate of participation listing all relevant values. We also began talks with our key suppliers on implementing our climate change mitigation requirements by means of a Supply Chain Emission Reductions task force.
The graphic presents our Scope 3 emissions from 2020 to 2023, broken down by emission source. In 2023, upstream emissions accounted for about 73 percent of our Scope 3 emissions, while downstream emissions accounted for about 26 percent. The basic data used to calculate Scope 3 emissions are reported in the benchmarking tool. More information about determination of Scope 3 emissions throughout the value chain is available here.
Our efforts to prevent greenhouse gases include relying on renewable energies, and reducing our energy consumption through more energy-efficient technologies. So far, however, this has not allowed us to prevent all CO2 emissions, which is why we offset those emissions by investing in certified climate change mitigation projects (including events in Germany).
Our Event Policy specifies the ways in which we offset emissions generated by events. In 2023, we offset over 17 000 metric tons of CO2 through various measures. 15 000 metric tons of CO2 were offset through renewable energy projects. We offset a further 1 400 metric tons of CO2 through carbon removal projects. The projects are designed to remove carbon from the atmosphere and store it on a permanent basis.
In t CO2
2021
2022
2023
Carbon offsets total
18 494
57 939
17 400
Carbon removal projects
1 329
12 000
2 400
Renewable energy projects
17 165
37 293
15 000
Energy efficiency projects
0
8 646
0
We are aiming to reach climate neutrality by the end of 2025. We plan to achieve this goal by investing in measures for capturing CO2 emissions and have defined the cornerstones of our strategy. We only consider projects that capture and store CO2 permanently or for the long term and satisfy the Oxford categories IV and V at a minimum. In this context, we conducted an extensive market study and will pursue a mixture of nature-based removals (through reforestation, for example) and tech-based removals (such as technological solutions for carbon disposal), with the aim of successively increasing the technology-oriented share. We also consider the failure of potential projects and their interaction with other requirements (such as local communities) in our planning, to ensure our objective of long-term capture.
Print
Through our interactive benchmarking tool, important facts and figures of our national companies can be analysed and compared.
Day after day, we work to
develop climate-neutral business
practices and establish circularity
In ramping up our climate targets, we have fulfilled the stringent criteria of the Science Based Targets initiative and become the first DAX-40 company to have a recognized, science-based net-zero climate target.
For the first time, we are outlining our route to net zero here in the form of a climate transition plan. We are already implementing the key measures set out in the plan. We achieved significant improvements in our KPI “Energy Intensity” by introducing efficiency measures in our networks and data centers.
To reduce Scope 3 emissions, we set up a task force that works closely with suppliers to explore new approaches to recording CO₂ emissions. Other sustainability criteria are applied to procurement decisions to create an economic incentive. One of the main criteria is the requirement to observe the principle of circularity for network technology and devices from the design and procurement stage onwards. When it comes to devices in particular, circularity can only be achieved in cooperation with customers. We addressed these stakeholders directly in 2023 by means of programs to purchase used devices, special initiatives, and our infotainment magazine “Heute retten wir die Welt! Ein bisschen.” (English: “Today we save the world! A little bit.”) on MagentaTV.
We support our customers in their efforts to adopt a more climate-friendly lifestyle. Our products and solutions generated positive CO₂ effects for our customers amounting to 16.9 million metric tons in Germany alone in 2023.
Further examples of our progress in 2023, from the perspective of the Group and that of our segments, can be found in the subchapters.
Highlight numbers
Highlight numbers
Progress of selected KPIs in 2023
20222023Progress
CO₂e emissions Scope 1&2 for the DT Group (in kt of CO₂e)233217-7%
CO₂e emissions Scope 1–3 for the DT Group (in kt of CO₂e)11 81110 476-11%
CPE Take-Back and Mobile Device Take Back for the DT Group (without TMUS)4.5m.4.8m.+7%